Using Session Recordings to Debug Onboarding Issues

Analytics tell you what users do. Session recordings show you why. When users struggle during onboarding, quantitative data shows where they drop off. But watching actual sessions shows you the confusion, frustration, and barriers that make them leave.
Think of session recordings as the microscope of UX research. They turn abstract metrics into observable human behavior. Problems become tangible. Solutions become obvious.
This guide covers how to use session recordings effectively to improve onboarding.
Users getting stuck?
Create step-by-step guides that prevent confusion before it happens with Glitter AI.
What Are Session Recordings?
Session recordings capture user interactions as playable video-like recordings. Every mouse movement, click, scroll, form interaction, and page navigation gets reconstructed. Unlike traditional screen recordings that create video files, modern tools log individual events and play them back as a visual recreation of the user's journey. This approach is cheaper to store and makes it easier to protect sensitive data through masking.
What They Capture
Session recordings show you how users actually experience your product, capturing way more than analytics can.
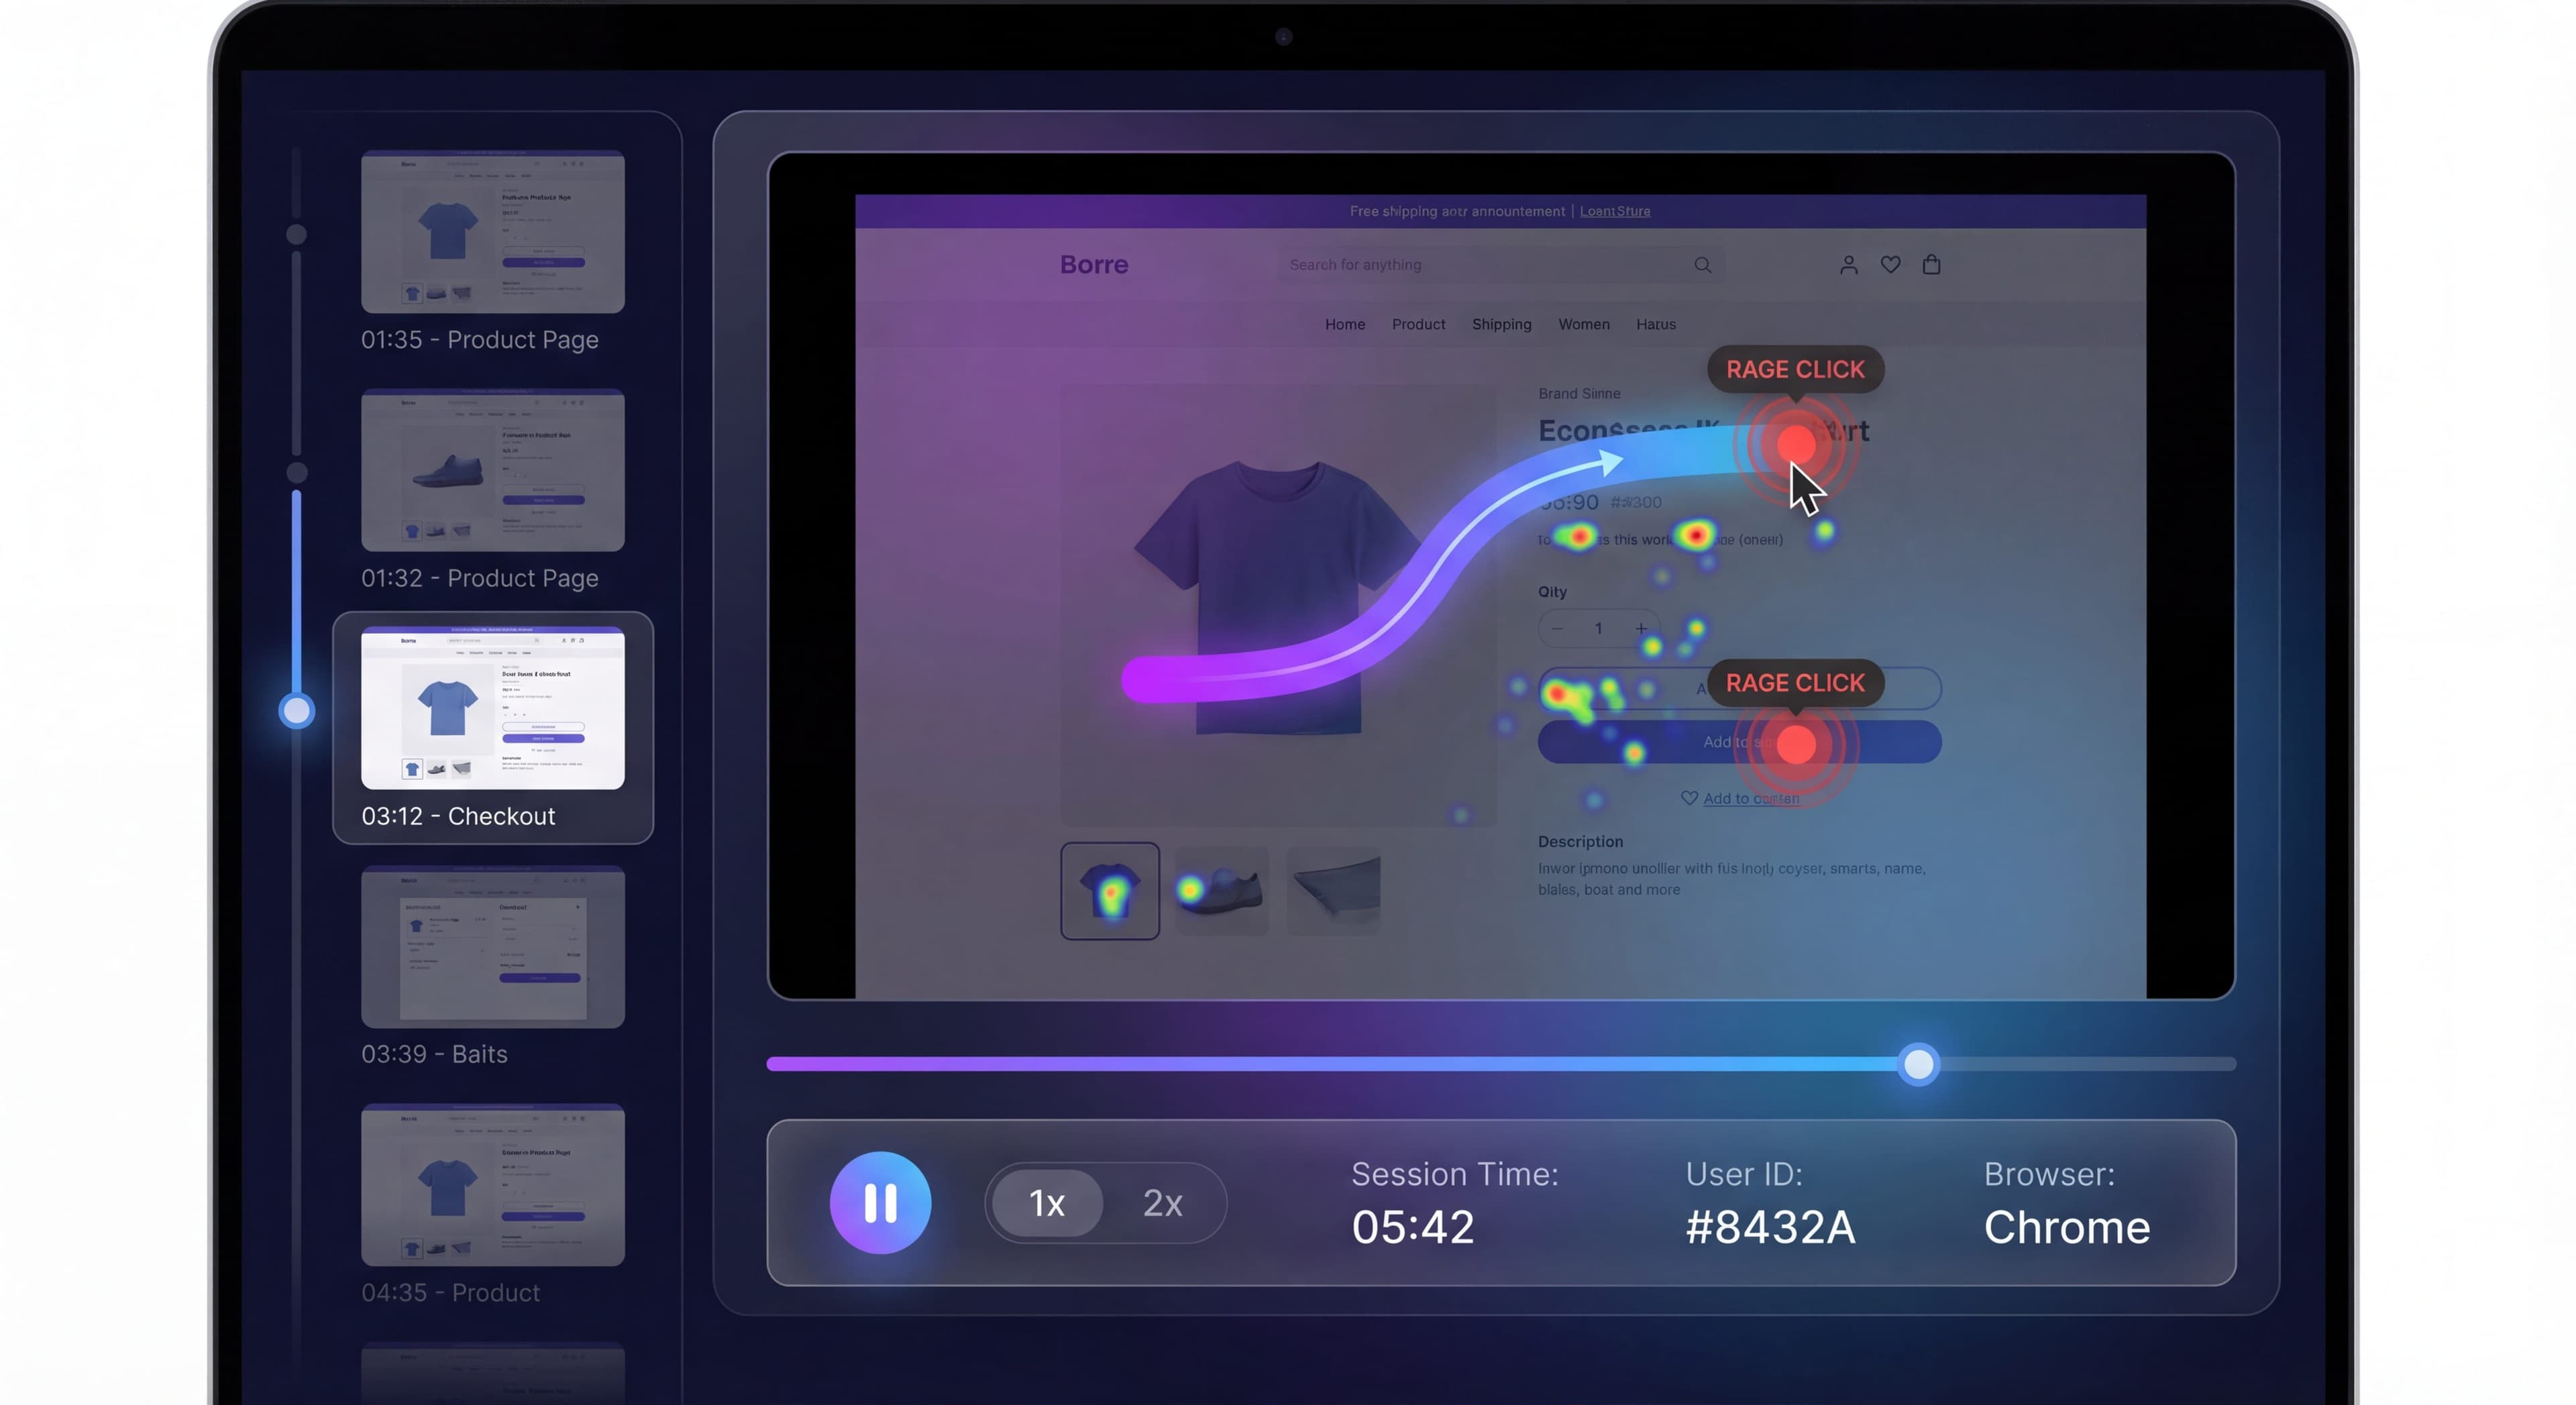
Mouse movement patterns reveal where users hover and move their cursor. You can spot attention patterns and hesitation moments that signal confusion. Every click gets logged, including frustrated attempts to click non-interactive elements. UX researchers call these "dead clicks" or "rage clicks" when users click repeatedly out of desperation.
Scrolling behavior shows how users navigate pages. Do they find what they need quickly? Or are they endlessly scrolling, hunting for features? Form interactions tell the full story of how users fill out fields: typing, deleting, correcting, hitting validation errors, abandoning. This explains why signup or checkout fails. Page navigation traces the exact path through your product. Which features did they discover? Which did they miss? Where did their journey end?
Time spent on each action adds context that raw events can't provide. You can tell the difference between someone pausing to read versus someone hesitating because they're confused. Recordings also catch bugs and technical issues, showing browser info, error messages, and the exact actions leading up to problems.
What They Don't Capture
You should understand the limitations too. Session recordings aren't actual video. They're reconstructions from logged events. They won't capture everything a traditional screen recording would.
User thoughts stay invisible, though you can often infer frustration, confusion, or satisfaction from behavior like rapid clicking, long pauses, or smooth navigation. Off-tab activity disappears. When users switch tabs, check email, or step away, you'll see a pause but won't know what happened elsewhere. Masked content, like passwords, credit card numbers, and other PII, gets hidden automatically by responsible tools to protect privacy and stay compliant with GDPR and CCPA.
Why Session Recordings for Onboarding?
The Limitations of Analytics
Analytics are great at measuring what happens. They're terrible at explaining why. Your dashboard might show 40% of users drop off at profile completion. Users spend an average of 3 minutes on the setup page. 25% click the help link before abandoning. These numbers point to problems but don't suggest solutions. You know the profile step is broken, but is it the job title field? A technical error? Notifications distracting them? Users deciding your product isn't worth it?
Analytics won't tell you why users abandon their profile, what they're actually doing during those 3 minutes, or what confused them enough to seek help before giving up. This gap between quantitative data and qualitative understanding leaves teams guessing. They often implement changes that miss the root cause entirely. Session recordings bridge that gap. They show exactly what users experience, turning abstract numbers into observable behavior.
What Recordings Reveal
Session recordings tell the human story behind your metrics. You see things analytics simply can't capture.
Confusion points become visible. Users hesitate before acting. They re-read instructions. Their cursor hovers uncertainly between options. They try actions in the wrong place. These moments of uncertainty usually precede abandonment. Spotting them lets you add clarity through better copy, visual hierarchy, or contextual help.
Friction sources emerge clearly. Technical problems like slow loading or broken interactions. Unclear UI where users can't find what they need. Unexpected behavior that violates how users expect interfaces to work. One language learning app discovered through recordings that their onboarding was overwhelming new users. Breaking it into smaller steps made people more likely to return.
Content issues surface when recordings show users misunderstanding copy, clicking CTAs that don't deliver what the button text promised, or reading the same paragraph multiple times trying to understand unclear instructions. Rage and frustration manifest as rapid clicking on unresponsive elements, erratic mouse movements, repeated form field entries after validation errors, and mouse thrashing while desperately searching for next steps. Success patterns matter too. They show what smooth, confident navigation looks like when users understand your interface and achieve their goals without friction.
Session Recording Tools
Primary Options
The market ranges from lightweight tracking to full digital experience platforms.
FullStory offers powerful recording with strong search and integrated analytics. You can search for sessions where users experienced specific events, exhibited certain behaviors, or matched particular characteristics. This search capability turns recordings from anecdotes into systematically analyzable data.
Hotjar has become popular for its affordability and combination of recordings with heatmaps and surveys. Teams that want multiple research methods without multiple vendors find it attractive.
LogRocket targets developers by focusing on error tracking and technical debugging. It captures JavaScript errors, network requests, and console logs alongside user interactions. Very useful for identifying technical issues causing onboarding failures.
Mouseflow combines recordings with funnel analysis, making it easy to watch recordings of users who dropped off at specific steps. Lucky Orange offers real-time viewing, letting teams watch sessions as they happen and potentially intervene with live chat when users look stuck.
Features to Consider
When choosing a tool, evaluate a few critical capabilities.
Recording fidelity determines how accurately interactions get captured. Some tools miss certain interaction types, especially in complex single-page apps or with embedded iframes. Higher fidelity means fewer gaps but potentially higher costs.
Search and filtering separates useful tools from frustrating ones. With thousands of recordings, you need robust search by user attributes, behaviors, errors, pages visited, or custom events. Saved filters like "users who abandoned during profile setup and hit an error" make analysis systematic rather than random. Segment integration lets you target recordings by plan type, acquisition source, company size, or behavioral cohort. Compare how different user segments experience onboarding.
Privacy controls are non-negotiable now. GDPR and CCPA require strict data protection. You need automatic masking of sensitive fields, manual designation of areas to mask, consent management, and data retention policies that automatically delete old recordings. Integrations with analytics platforms, support tools, and product management systems determine whether recordings exist in isolation or fit into your broader workflow.
Privacy and Compliance
Essential Protections:
- Mask sensitive fields (passwords, payment)
- Mask PII (emails, names) if required
- Consent notices where required
- Data retention policies
- Access controls
GDPR/CCPA Considerations:
- Recording consent
- Data subject rights
- Cross-border data transfer
What to Look For
Frustration Signals
Rage Clicks:
Rapid, repeated clicking on same element.
Dead Clicks:
Clicking on non-clickable elements.
Mouse Thrashing:
Erratic cursor movement indicating confusion.
Form Struggles:
Repeated errors, clearing and retyping.
Abandonment Patterns:
Where and how users leave.
Confusion Indicators
Excessive Scrolling:
Looking for something, can't find it.
Re-reading:
Cursor re-traces content.
Wrong Path:
Attempting action in wrong place.
Hesitation:
Long pauses before action.
Help Seeking:
Opening help, searching docs.
Success Patterns
Smooth Flow:
Confident, direct navigation.
Quick Completion:
Efficient task execution.
Feature Discovery:
Natural exploration.
Engagement:
Deep interaction with content.
Structuring Your Analysis
Funnel-Based Approach
Focus on specific onboarding stages:
- Identify drop-off point from analytics
- Filter recordings to users at that stage
- Watch subset of recordings
- Categorize issues observed
- Quantify frequency
- Prioritize fixes
Example:
Profile completion has 30% drop-off.
- Watch 20 recordings of users who abandoned
- Find: 12 confused by job title field, 5 got distracted, 3 technical errors
- Fix: Make job title field clearer or optional
Segment-Based Approach
Focus on specific user types:
- Identify underperforming segment
- Filter recordings to that segment
- Compare to high-performing segment
- Note behavioral differences
- Identify intervention opportunities
Example:
Developer segment has 20% lower activation.
- Watch developer sessions vs. marketing sessions
- Find: Developers skip tour, miss key setup step
- Fix: Developer-specific onboarding path
Issue-Based Approach
Focus on reported problems:
- User reports issue or confusion
- Find their session recording
- See exactly what happened
- Identify root cause
- Fix and verify
Sampling Strategies
How Many to Watch
Discovery Phase:
20-30 recordings per segment to identify issues.
Validation Phase:
10-15 recordings to confirm patterns.
Ongoing Monitoring:
5-10 recordings per week for trends.
Selection Criteria
Random Sampling:
Unbiased view of typical behavior.
Targeted Sampling:
- Specific drop-off points
- Underperforming segments
- After changes
Edge Cases:
- Very fast completers
- Very slow completers
- Multiple session users
Avoiding Bias
Don't Just Watch Failures:
Success patterns are equally valuable.
Vary Time Periods:
Account for time-of-day effects.
Include Segments:
Different user types behave differently.
Recording Analysis Process
Same questions over and over?
Create self-serve documentation that empowers users to help themselves with Glitter AI.
Individual Recording Analysis
Before Watching:
- Note user attributes (segment, source, plan)
- Know their analytics data (events, outcomes)
- Set analysis questions
While Watching:
- Note specific timestamps of issues
- Categorize behaviors observed
- Track friction points
- Document quotes/observations
After Watching:
- Summarize key observations
- Tag recording for future reference
- Update issue tracking
Cross-Recording Analysis
Pattern Identification:
What issues appear repeatedly?
Frequency Assessment:
How common is each issue?
Severity Rating:
How much does each issue impact success?
Root Cause:
What's the underlying problem?
Documentation Template
Session Analysis: [Recording ID]

User Info:
- Segment: [segment]
- Source: [acquisition source]
- Outcome: [converted/abandoned]

Key Observations:
1. [Timestamp]: [Observation]
2. [Timestamp]: [Observation]

Friction Points:
- [Description] at [location]

Overall Assessment:
[Summary of experience quality]

Recommendations:
- [Specific improvement]
Combining with Other Data
Session Recordings + Analytics
Analytics First:
Identify what to investigate.
Recordings Second:
Understand why it happens.
Example Flow:
- Analytics shows 40% drop-off at step 3
- Watch recordings of users at step 3
- Discover confusion about terminology
- Implement fix
- Analytics confirm improvement
Session Recordings + Surveys
Survey Reveals:
"The setup process was confusing"
Recording Shows:
Exactly what was confusing.
Combined Insight:
Specific, actionable improvement.
Session Recordings + Support
Ticket:
"I couldn't figure out how to add my team"
Recording:
Shows them looking in wrong place, missing button.
Resolution:
Make team invite button more prominent.
Taking Action on Findings
Prioritization Framework
Impact × Frequency = Priority
| Issue | Frequency | Impact | Priority |
|---|---|---|---|
| Unclear CTA | 15/20 | High | Critical |
| Slow loading | 5/20 | Medium | Medium |
| Edge case bug | 2/20 | High | Medium |
| Minor confusion | 8/20 | Low | Low |
Types of Fixes
Copy Changes:
Clarify confusing language.
UI Improvements:
Make interactions more obvious.
Flow Changes:
Reorder or simplify steps.
Technical Fixes:
Resolve bugs or performance issues.
Education Additions:
Add tooltips, guidance, help.
Verification
After fixes:
- Wait for new recordings
- Watch sessions at same point
- Confirm issue is resolved
- Monitor analytics for improvement
Same questions over and over?
Create self-serve documentation that empowers users to help themselves with Glitter AI.
Best Practices
Watching Effectively
Set Time Limits:
2-4 hours per analysis session maximum.
Use Playback Speed:
Speed up boring parts, slow for key moments.
Take Notes in Real-Time:
Capture observations as you see them.
Watch with Purpose:
Know what you're looking for.
Sharing Findings
Clip Key Moments:
Create shareable clips of important behavior.
Categorize Issues:
Organize findings by type and location.
Present Visually:
Show recordings in team reviews.
Track Progress:
Update team as issues are fixed.
Ethical Considerations
Respect Privacy:
Treat recordings as sensitive data.
Use for Improvement:
Not for surveillance or punitive purposes.
Protect Data:
Follow retention and access policies.
Get Consent:
Where required by regulation.
Common Mistakes
Mistake 1: Analysis Paralysis
Problem: Watching hundreds of recordings without action.
Fix: Set specific questions, take action on findings.
Mistake 2: Confirmation Bias
Problem: Finding what you expect to find.
Fix: Random sampling, blind analysis.
Same friction points appearing?
Build clear SOPs that eliminate common pain points you discover in recordings with Glitter AI.
Mistake 3: Small Sample Conclusions
Problem: Drawing conclusions from few recordings.
Fix: Ensure sufficient sample size.
Mistake 4: Ignoring Success
Problem: Only watching problematic sessions.
Fix: Study successful patterns too.
Mistake 5: No Follow-Through
Problem: Identifying issues without fixing them.
Fix: Action-oriented analysis process.
The Bottom Line
Session recordings turn abstract data into observable human experience. You see the frustration behind drop-off rates, the confusion behind support tickets, the satisfaction behind successful onboarding.
What to remember:
- Recordings explain the "why" behind metrics
- Sample systematically, not randomly
- Look for patterns, not just individual issues
- Combine with other data sources
- Actually act on what you find
The goal isn't just watching users. It's seeing your product through their eyes so you can make it work better for them.
Continue learning: Funnel Analysis and User Feedback Surveys.
Frequently Asked Questions
How can session recordings help improve user onboarding?
Session recordings reveal the 'why' behind drop-off metrics by showing actual user behavior. They expose confusion points, friction sources, content issues, and rage clicking that analytics alone cannot capture. Watch users struggle to understand what specific changes will improve activation.
What user frustration signals should I look for in session replays?
Key frustration signals include rage clicks (rapid repeated clicking), dead clicks on non-clickable elements, mouse thrashing indicating confusion, form struggles with repeated errors, excessive scrolling looking for something, hesitation before actions, and help-seeking behavior.
How many session recordings should I watch for onboarding analysis?
For discovery, watch 20-30 recordings per segment to identify issues. For validation, 10-15 recordings confirm patterns. For ongoing monitoring, review 5-10 weekly to spot trends. Include both successful and failed sessions, vary time periods, and sample different user segments.
What are the best session recording tools for debugging onboarding?
Popular options include FullStory for comprehensive recording with search and analytics, Hotjar for affordability with heatmaps and surveys, LogRocket for developer-focused error tracking, Mouseflow for funnel analysis, and Lucky Orange for real-time viewing capabilities.
How do I combine session recordings with analytics for onboarding optimization?
Use analytics first to identify what to investigate (like 40% drop-off at step 3), then watch recordings to understand why it happens. Combine with surveys to connect user feedback to actual behavior, and link support tickets to specific sessions to identify root causes.