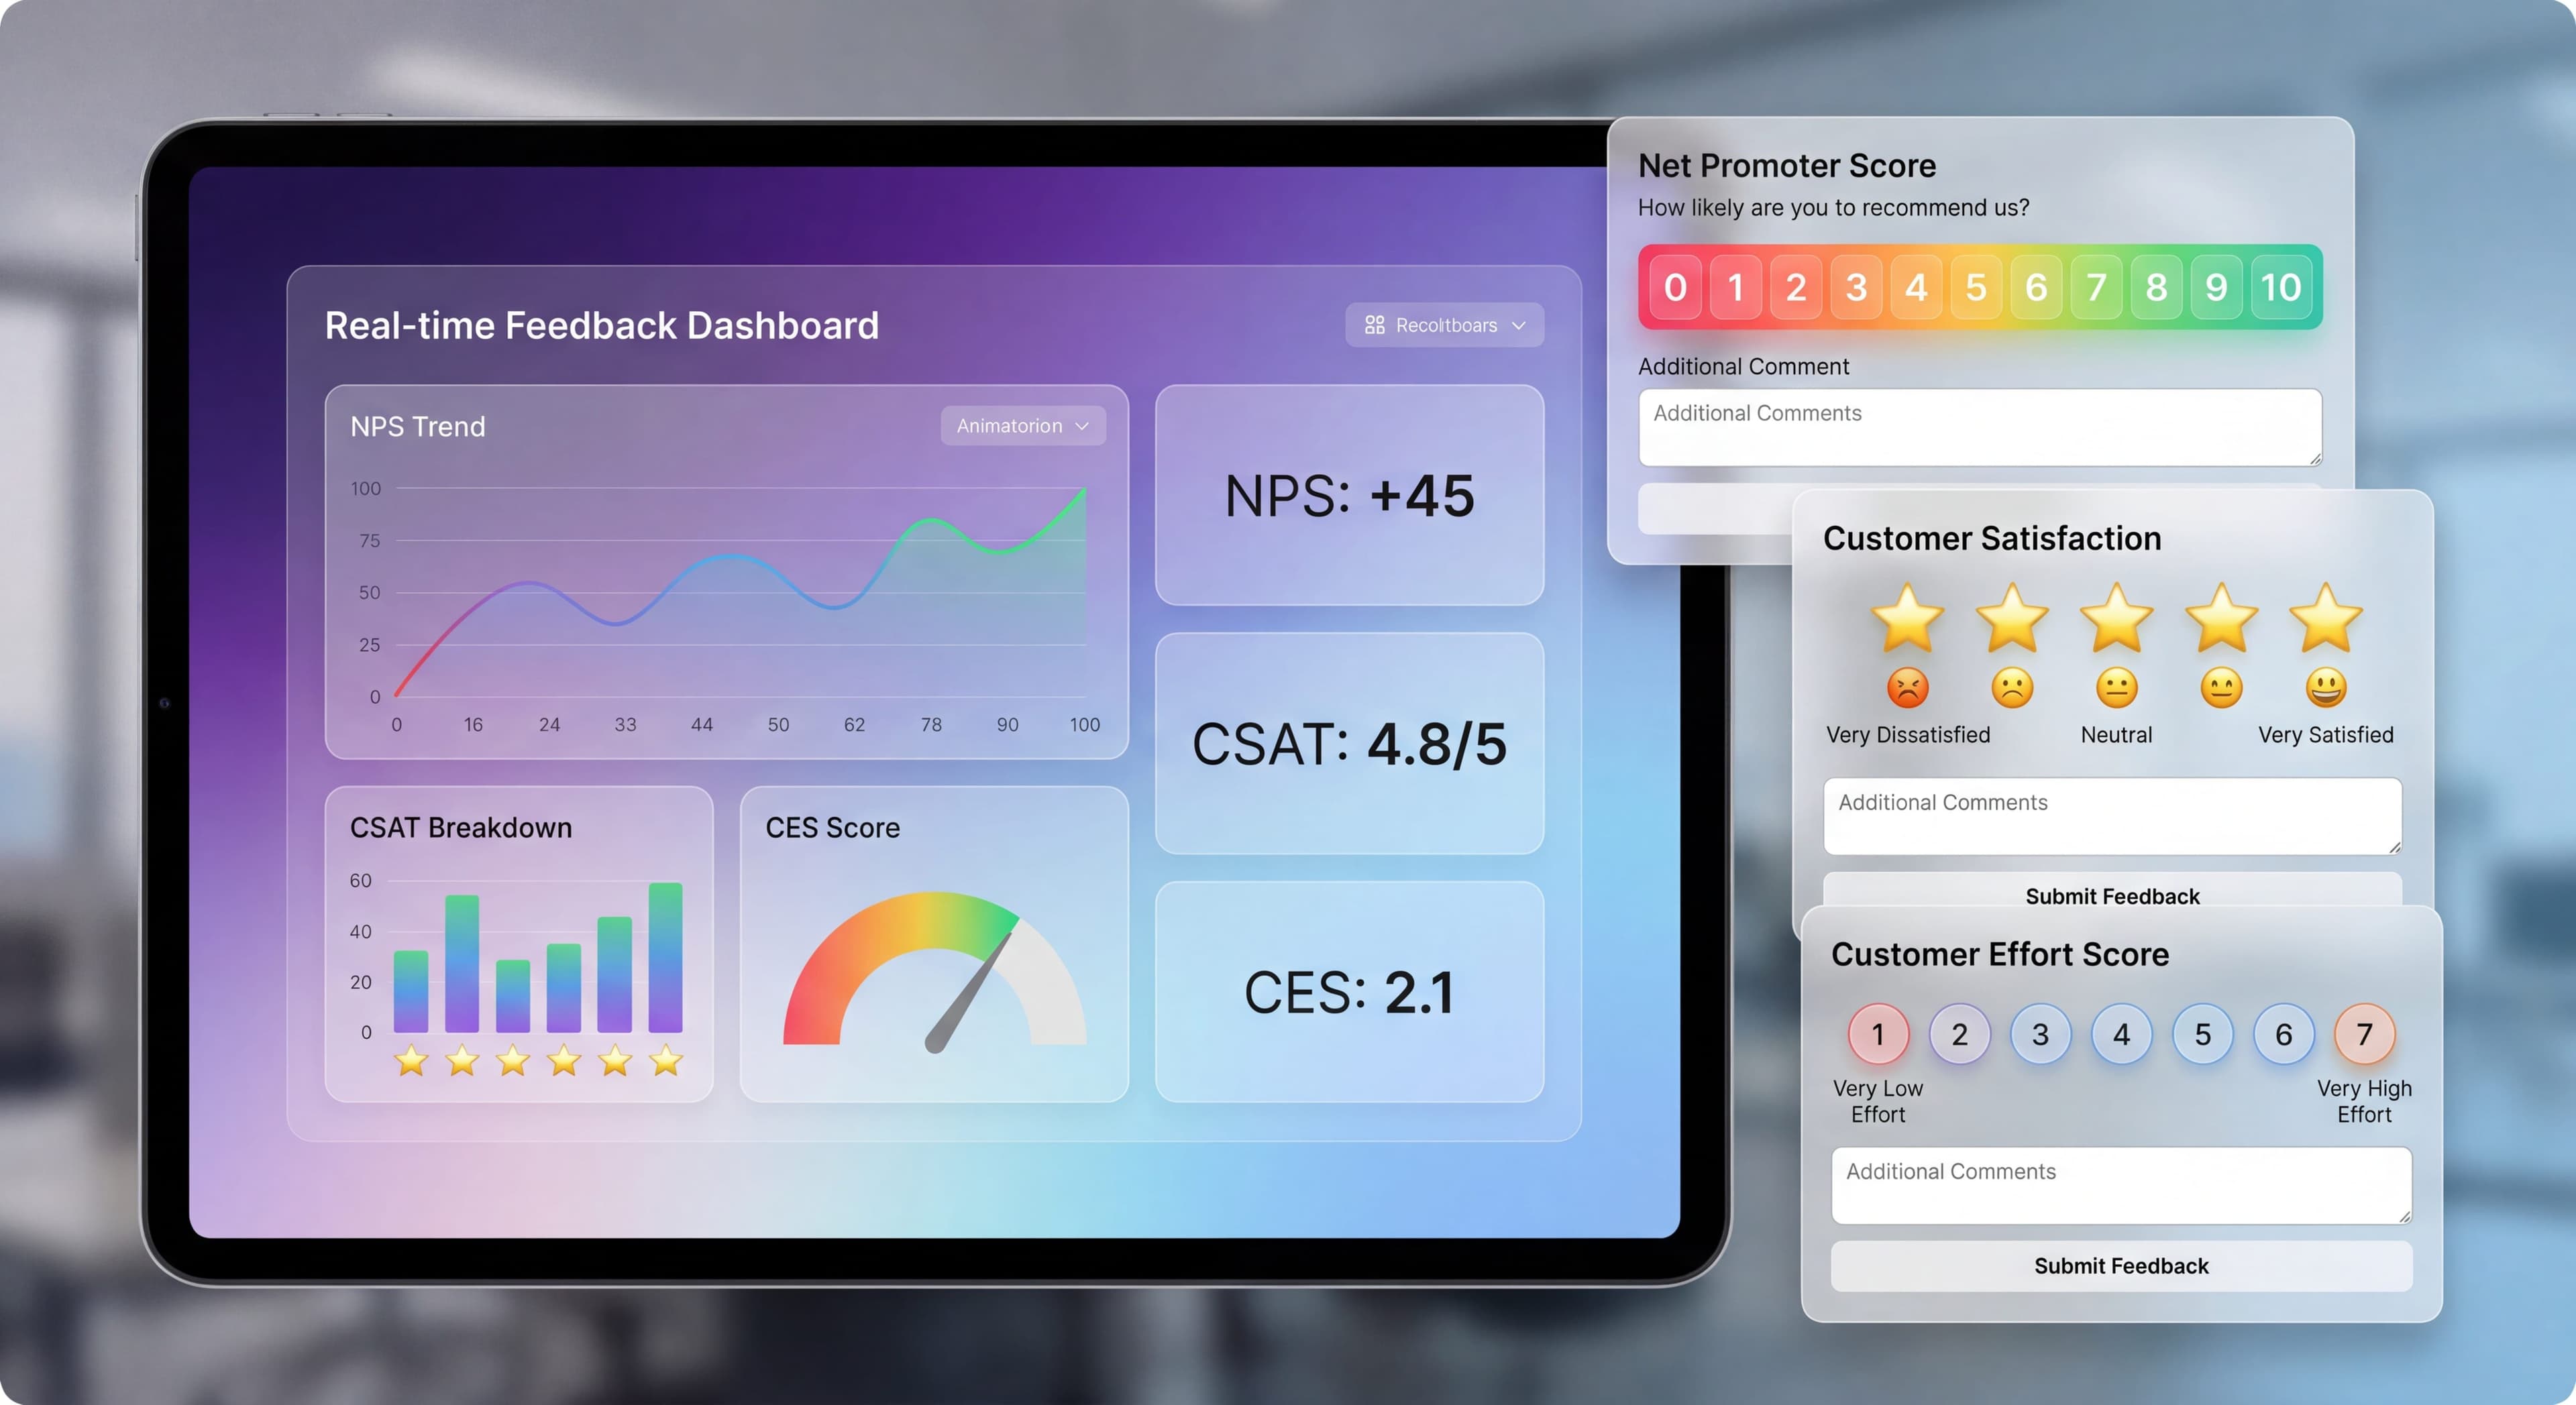
NPS, CSAT, and CES: Measuring User Sentiment During Onboarding

Analytics tell you what users do. Surveys tell you what they think and feel. Put them together and you get the full picture of how well your onboarding actually works.
The right survey at the right moment? Gold. Too many surveys, or poorly timed ones? That's just noise and annoyance.
Here's how to measure sentiment in ways that help your onboarding rather than hurt it.
Users dropping off silently?
Create step-by-step guides that reduce friction and give you fewer reasons to survey in the first place with Glitter AI.
The Three Core Surveys
Net Promoter Score (NPS)
The Question:
"How likely are you to recommend [Product] to a friend or colleague?"
Scale:
0-10
Scoring:
- Detractors (0-6): Unhappy users
- Passives (7-8): Satisfied but unenthusiastic
- Promoters (9-10): Enthusiastic advocates
NPS Calculation:
% Promoters - % Detractors
NPS works well as an indicator of overall customer loyalty and how healthy your relationship with users really is. According to Retently, an NPS above 30 is considered good for most SaaS companies in 2026, while scores above 50 suggest strong loyalty and advocacy. The real value isn't just the number though. It's understanding why people gave that score. When you ask "What's the main reason for your score?" you get qualitative insights that numbers alone can't give you. This mix of numeric and narrative feedback helps you spot both widespread issues and weird edge cases you might otherwise miss. One thing to keep in mind: NPS surveys work best after users have actually experienced some value from your product, not right after signup when they don't have enough context to form a real opinion.
Best For:
- Overall relationship health
- Benchmarking over time
- Comparing to industry
Customer Satisfaction (CSAT)
The Question:
"How satisfied are you with [specific experience]?"
Scale:
Usually 1-5 or 1-7
Scoring:
% giving top scores (4-5 on 5-point scale)
CSAT surveys work best when you send them right after specific touchpoints in the user journey. Userpilot's benchmarking research suggests sending them after key interactions like onboarding sessions, support resolutions, or feature discoveries to see if those experiences actually worked. Timing matters a lot here. You want to catch users while the experience is still fresh in their minds. SurveyVista research backs this up: for sales, onboarding, or support interactions, immediate feedback gives you the most reliable results. Say you're trying to improve user onboarding and retention. Sending a CSAT survey right after an onboarding session lets users tell you how they felt about the training materials and support they got. Unlike NPS, which measures overall relationship health, CSAT gives you granular feedback on specific moments. That makes it really useful for finding friction in particular workflows or features. You can make targeted fixes instead of guessing at sweeping changes.
Best For:
- Specific interaction feedback
- Immediate experience assessment
- Targeted improvement
Customer Effort Score (CES)
The Question:
"How easy was it to [complete specific task]?"
Scale:
Usually 1-5 or 1-7
Scoring:
Average score or % giving low effort scores
Customer Effort Score has become one of the most predictive metrics for onboarding success because it directly measures friction. Research from Delighted and AskNicely shows that CES correlates more strongly with customer retention than either NPS or CSAT, especially during onboarding. Here's the interesting part: users who report low effort completing onboarding tasks stick around much longer than users who report high satisfaction but struggled through the process. That finding might seem backwards, but it reveals something important. Ease of use often matters more than delight during onboarding. Send CES surveys right after users complete critical tasks like account setup, first project creation, or integration connection. You want to capture the experience while it's fresh. For example, after someone signs up for a subscription service, asking "How easy was it to understand the setup instructions?" gives you actionable insights into where your process creates unnecessary friction. Poor onboarding accounts for 23% of average customer churn according to customer success research. That makes CES measurement during this phase critical for retention.
Best For:
- Friction identification
- Process optimization
- Onboarding effectiveness
Which Survey When
For Onboarding, Use CES
Why CES Works for Onboarding:
- Directly measures friction
- Correlates strongly with retention
- Actionable insights
- Specific to experience
CES works so well for onboarding because it focuses on what users actually experienced, not just how they feel about it emotionally. A user might love your product's design but still churn if they struggled through a complicated setup. CustomerGauge research shows that CES is particularly effective at finding friction points across the customer journey, from checkout to onboarding workflows to support interactions. You can ask something like "How easy was it to set up your account and start using the software?" and get direct insight into barriers that might cause people to give up. The actionable nature of CES responses is what makes it so useful for product teams. When users report high effort for a specific task, you know exactly where to dig in. Helpdesk.com analysis shows that segmenting CES results by interaction type helps you pinpoint specific trouble spots. Segmenting further by user characteristics reveals that different types of users experience different levels of effort for the same tasks.
Research Finding:
Users who report low effort are more likely to stick around than those who report high satisfaction but high effort. This finding, backed by multiple studies from Delighted and PostHog, challenges the assumption that customer delight drives retention. During onboarding specifically, reducing friction matters more than creating moments of joy. A user who breezes through setup in five minutes with a "meh" experience will probably stick around longer than someone who completes a delightful but complex 30-minute onboarding flow. Think about what that means for how product teams should approach onboarding: prioritize simplicity and clarity over impressive features or elaborate welcome experiences.
NPS Timing
When to Ask:
- After significant milestones (not during onboarding)
- Periodically for existing users
- After achieving value
When Not to Ask:
- During active onboarding
- Before users experience value
- Too frequently
CSAT Timing
When to Ask:
- After specific interactions (support, feature use)
- Post-completion of significant tasks
- For comparative measurement
Designing Effective Surveys
Keep It Short
Ideal Length:
- 1 primary question
- 1 follow-up (optional open text)
- Maximum 30 seconds to complete
Survey length has a big impact on completion rates and response quality. HiverHQ research suggests that one survey per interaction works best, maybe followed by a single open-ended prompt for context. When surveys get longer than that, completion rates drop fast. Response quality suffers too as users rush through to get it over with. The 30-second completion time isn't arbitrary. It's about the maximum attention span users will give to feedback during their product experience. Go over that threshold and abandonment spikes. You end up with biased data from your most patient users, who may not represent everyone. The single primary question forces you to figure out exactly what insight you're after. This prevents the common mistake of trying to learn everything at once and learning nothing useful instead. The optional follow-up question acts as a pressure release valve. Users with strong opinions can elaborate. Users with simple feedback don't have to wade through extra fields.
Write Clear Questions
Specific, Not Vague:
Bad: "How was your experience?"
Good: "How easy was it to create your first project?"
Neutral, Not Leading:
Bad: "Did you enjoy our amazing onboarding?"
Good: "How would you rate the onboarding experience?"
Include Open-Ended Follow-Up
Always Ask Why:
"What's the primary reason for your score?"
This provides:
- Context for quantitative scores
- Specific improvement suggestions
- Quotable feedback
Survey Templates
CES for Onboarding:
How easy was it to get started with [Product]?

[ Very Difficult ] [ Difficult ] [ Neutral ] [ Easy ] [ Very Easy ]

What could we do to make it easier?
[Text field]
CSAT for Specific Step:
How satisfied are you with the setup process?

[ Very Dissatisfied ] [ Dissatisfied ] [ Neutral ] [ Satisfied ] [ Very Satisfied ]

Any feedback you'd like to share?
[Text field]
Mini NPS After Value:
How likely are you to recommend [Product] to a colleague?

[ 0 ] [ 1 ] [ 2 ] [ 3 ] [ 4 ] [ 5 ] [ 6 ] [ 7 ] [ 8 ] [ 9 ] [ 10 ]

What's the main reason for your score?
[Text field]
Timing Your Surveys
Onboarding Survey Points
After Onboarding Completion:
Best moment for overall CES about onboarding.
After First Value Achievement:
CSAT about getting to that first success.
After First Week:
Mini NPS if appropriate for your product.
Avoid Survey Fatigue
Rules:
- No more than 1 survey per session
- Minimum 7 days between surveys per user
- Don't survey users who just submitted feedback
- Allow permanent dismissal
Survey fatigue is one of the biggest threats to your feedback program's long-term health. When users feel bombarded with requests for their opinion, they start ignoring all surveys, unsubscribe from communications, or worse, develop negative feelings about your product itself. Retently and HiverHQ research confirms that one CES survey per customer per month is the absolute maximum, and that should only apply when users are engaging with different departments or distinct services. The seven-day minimum between surveys gives users breathing room to have new experiences worth reporting on. It also prevents them from feeling like you're constantly interrupting their work to ask questions. Here's something critical: you need suppression logic that prevents surveying users who just submitted feedback through any channel, whether that's a survey response, support ticket, or direct message. Nothing frustrates users more than being asked their opinion right after they just shared detailed feedback elsewhere. Letting users permanently dismiss surveys respects their autonomy. Paradoxically, it often results in higher-quality responses since people who do participate are engaging voluntarily rather than feeling forced.
Trigger Strategies
Time-Based:
X days after signup, regardless of behavior.
Behavior-Based:
After completing specific actions.
Hybrid:
After action AND within time window.
Implementing Surveys
In-App Surveys
Pros:
- Higher response rates
- Contextually relevant
- Immediate feedback
Cons:
- Can interrupt workflow
- Limited question formats
- May feel intrusive
Best Practices:
- Non-blocking (can dismiss)
- Positioned unobtrusively
- Clear, quick to complete
Email Surveys
Pros:
- Less intrusive
- Longer surveys possible
- Reaches inactive users
Cons:
- Lower response rates
- Less contextual
- Delayed feedback
Best Practices:
- Send within 24 hours of experience
- Clear subject line
- One-click first question
Survey Tools
Dedicated Survey Tools:
- Typeform
- SurveyMonkey
- Delighted
Built into DAPs:
- Userpilot (NPS, surveys)
- Appcues (surveys)
- Pendo (NPS, surveys)
Customer Success Tools:
- Intercom
- Zendesk
Analyzing Survey Results
Knowledge stuck in silos?
Create step-by-step guides that share expertise across your entire team with Glitter AI.
Quantitative Analysis
Track Over Time:
- Trend lines for scores
- Cohort comparison
- Before/after changes
Segment Analysis:
- By user type
- By onboarding path
- By acquisition source
Correlation Analysis:
- Survey scores vs. retention
- Survey scores vs. conversion
- Survey scores vs. feature adoption
Qualitative Analysis
Categorize Responses:
- Feature requests
- Confusion/friction
- Praise
- Technical issues
- Suggestions
Frequency Count:
How often each category appears.
Quote Mining:
Extract powerful quotes for reporting.
Creating Insights
What to Look For:
Trends:
Improving or declining over time?
Patterns:
Certain segments consistently score differently?
Outliers:
Unusually high or low scores?
Correlations:
What predicts high/low scores?
Acting on Feedback
Closing the Loop
Acknowledge Feedback:
Let users know you heard them.
Act on Feedback:
Actually make improvements.
Communicate Changes:
Tell users what changed based on feedback.
Prioritization Framework
For Negative Feedback:
| Category | Frequency | Impact | Fixability | Priority |
|---|---|---|---|---|
| Confusion X | High | High | Easy | Critical |
| Missing Y | Medium | High | Medium | High |
| Bug Z | Low | High | Hard | Medium |
| Request W | High | Low | Easy | Low |
Response Strategies
Promoters (NPS 9-10):
- Thank them
- Ask for referral/review
- Invite to beta programs
Passives (NPS 7-8):
- Ask what would make it a 10
- Address specific concerns
- Follow up after improvements
Detractors (NPS 0-6):
- Reach out personally
- Understand specific issues
- Offer help to resolve
Survey Benchmarks
NPS Benchmarks
B2B SaaS:
- Average: 30-40
- Good: 40-50
- Excellent: 50+
B2C SaaS:
- Average: 20-30
- Good: 30-40
- Excellent: 40+
CSAT Benchmarks
General:
- Average: 75-80%
- Good: 80-85%
- Excellent: 85%+
CES Benchmarks
Depends on scale, but generally:
- Low effort (good): 1-2 on 5-point scale
- High effort (bad): 4-5 on 5-point scale
Benchmark Caution
Industry Varies:
Different industries have different norms.
Context Matters:
Your specific situation may differ.
Internal Trends:
More valuable than external benchmarks.
Knowledge stuck in silos?
Create step-by-step guides that share expertise across your entire team with Glitter AI.
Common Survey Mistakes
Mistake 1: Survey Overload
Problem: Too many surveys, too often.
Result: Fatigue, low response rates, annoyance.
Fix: Strategic, limited survey deployment.
Mistake 2: Bad Timing
Problem: Surveying at wrong moments.
Result: Low relevance, inaccurate responses.
Fix: Trigger surveys contextually.
Mistake 3: Vague Questions
Problem: Generic, unclear questions.
Result: Unactionable responses.
Fix: Specific, clear question design.
Mistake 4: No Follow-Up
Problem: Collecting data without acting.
Result: Wasted opportunity, user frustration.
Fix: Process for analyzing and acting on feedback.
Mistake 5: Ignoring Open Text
Problem: Only analyzing quantitative scores.
Result: Missing rich qualitative insights.
Fix: Systematic open-text analysis.
Mistake 6: Leading Questions
Problem: Questions that bias responses.
Result: Invalid data.
Fix: Neutral question wording.
Building a Feedback System
Components
Collection:
- Survey tools configured
- Triggers defined
- Questions written
Storage:
- Responses stored
- Linked to user data
- Historical tracking
Analysis:
- Regular review cadence
- Analysis framework
- Reporting format
Action:
- Prioritization process
- Improvement tracking
- Communication plan
Review Cadence
Weekly:
- Quick scan of responses
- Flag urgent issues
- Note trends
Monthly:
- Full analysis
- Segment comparison
- Action planning
Quarterly:
- Trend review
- Strategy adjustment
- Goal setting
Survey says users are confused?
Create step-by-step guides that answer the questions users keep asking with Glitter AI.
The Bottom Line
Onboarding surveys add the "why" to your analytics. They reveal sentiment that behavior data alone can't show. But you have to deploy them thoughtfully. The wrong survey at the wrong time creates more problems than insights.
Key Principles:
- CES is best for measuring onboarding friction
- Timing matters, so survey at relevant moments
- Keep surveys short and specific
- Always include an open-ended follow-up
- Actually act on what you learn
The best survey strategy is one users barely notice but still provides rich, actionable insights. That balance takes work, but it's worth pursuing.
Continue learning: Session Recordings and Onboarding Metrics KPIs.
Frequently Asked Questions
Which survey type is best for measuring onboarding effectiveness?
Customer Effort Score (CES) is the best survey for measuring onboarding effectiveness because it directly measures friction, correlates strongly with retention, and provides actionable insights specific to the onboarding experience.
When should you send NPS surveys during onboarding?
NPS surveys should be sent after users achieve significant milestones and experience product value, not during active onboarding. The ideal timing is after the first week or after users complete their first meaningful outcome.
How do you avoid survey fatigue during user onboarding?
Limit surveys to one per session, wait at least 7 days between surveys per user, avoid surveying users who just submitted feedback, and always allow permanent dismissal of survey prompts.
What is a good CSAT score for SaaS onboarding?
A good CSAT score for SaaS onboarding is 80-85%, with average scores typically ranging from 75-80%. Excellent scores are 85% or higher, indicating users are highly satisfied with the onboarding experience.
How do you write effective onboarding survey questions?
Write specific questions like 'How easy was it to create your first project?' instead of vague ones like 'How was your experience?' Keep surveys to 1 primary question with an optional open-text follow-up, and ensure questions are neutral rather than leading.