Product Analytics for Onboarding: Choosing and Using the Right Tools

You can't fix what you can't see. Product analytics show you where users get stuck, what drives activation, and whether your changes actually work.
Picking the right tools and setting them up properly is the difference between making decisions based on data versus gut feelings. Here's how to choose, implement, and actually use analytics to improve your onboarding.
Data but no action?
Create step-by-step guides that turn analytics insights into user improvements with Glitter AI.
Why Product Analytics for Onboarding?
Optimizing based on gut feelings versus actual data often determines whether onboarding works or wastes everyone's time. Analytics help you understand not just what's happening, but why it's happening and what to do about it. Without proper tracking, you're iterating blind.
What Analytics Enable
Measurement turns vague goals like "improve activation" into concrete numbers you can track. Once you're measuring activation thresholds and retention milestones, you can actually tell if things are getting better or worse. Without measurement, you can't distinguish between seasonal variations and real improvements.
Diagnosis shows you not just that people are dropping off, but exactly where and why. Instead of "onboarding isn't working," you get "65% of mobile users abandon at profile setup, compared to 25% on desktop." That kind of precision lets you focus on actual problems instead of guessing.
Testing separates real improvements from changes that feel good but don't help. A/B testing with proper event tracking tells you whether reducing signup fields actually improved activation, or just shifted the drop-off somewhere else. You build real knowledge about what works instead of repeating mistakes.
Segmentation reveals how different users experience onboarding. Maybe enterprise users need more guidance while individuals want to be left alone. Maybe paid ad traffic converts better with immediate value while organic traffic prefers thorough tours. These patterns let you personalize instead of compromising with one-size-fits-all.
Prediction identifies early behaviors that forecast success or churn. If users who complete a specific action in their first session retain at 3x the rate of others, that action becomes an onboarding priority. Patterns that correlate with churn tell you where to intervene.
Analytics vs. Web Analytics
Google Analytics is great for tracking website traffic and page views. But knowing someone visited your signup page tells you nothing about whether they activated, which features they used, or why they churned two weeks later.
Product analytics track what users actually do inside your product. Instead of page views, you track events like "project_created" or "team_member_invited." Instead of anonymous visitors, you follow identified users from signup through activation, retention, and churn.
For onboarding, you need product analytics. Web analytics can't track events within your product, build funnels showing conversion between steps, analyze cohorts, or correlate early actions with long-term success. Different tools for different jobs.
Product Analytics Landscape
Several strong platforms compete for attention here. There's no universal "best" choice. It depends on your needs, resources, and how analytically mature your team is.
Major Players
Amplitude built its reputation on behavioral analytics and cohort analysis. It's great for understanding complex user journeys and building predictive models. The approach emphasizes getting your event taxonomy right upfront, which takes more effort but pays off with powerful analysis capabilities. Free tier supports up to 10 million monthly events. Implementation typically takes one day to three weeks depending on complexity.
Mixpanel focuses on event analytics and funnel visualization. Real-time tracking and intuitive funnel builders make it effective for teams that want fast insights into how changes affect conversion. Their philosophy is more "start tracking now, refine later" rather than requiring perfect taxonomy from day one. Free tier supports up to 20 million monthly events, and most teams finish onboarding within 40 days. Good fit for early-stage and scaling SaaS.
Heap automatically captures everything users do without manual event tagging. You can ask questions about historical data even if you didn't think to track specific events before. This is appealing if you have limited engineering resources or aren't sure yet which metrics matter most. The downside: higher pricing (contact sales) and potentially noisy data from capturing events you never analyze.
Pendo combines product analytics with built-in in-app guidance. You get analytics and onboarding tools in one platform, so there's no integration needed between them. When analytics show something interesting, you can immediately create guidance to act on it. Path analysis, funnels, cohorts, and retroactive analytics are all included. Custom pricing, but a good fit if you want a unified platform.
Specialized Options
PostHog:
Open-source, self-hostable, feature flags included.
Segment:
Customer Data Platform that routes to analytics tools.
Rudderstack:
Open-source CDP alternative.
DAP-Integrated Analytics
Many onboarding platforms include analytics:
- Userpilot: Strong analytics built-in
- Appcues: Basic analytics, integrates with dedicated tools
- Pendo: Full analytics platform
Choosing the Right Tool
Decision Framework
Question 1: What's Your Budget?
- $0-$1K/year: Free tiers (Amplitude, Mixpanel, PostHog)
- $1K-$10K/year: Growth tiers of major platforms
- $10K+/year: Enterprise features, higher volume
Question 2: Technical Resources?
- Minimal: Heap (auto-capture), Pendo
- Moderate: Amplitude, Mixpanel
- Strong: PostHog, custom solutions
Question 3: Analysis Complexity?
- Basic: Most tools work
- Advanced: Amplitude, Mixpanel excel
- Custom: Consider data warehouse approach
Question 4: Integration Needs?
- Standalone: Any tool
- With onboarding platform: Check integrations
- With full stack: Consider Segment/CDP
Comparison Matrix
| Feature | Amplitude | Mixpanel | Heap | Pendo |
|---|---|---|---|---|
| Free Tier | Yes | Yes | Limited | No |
| Event Tracking | Manual | Manual | Auto | Manual |
| Cohorts | Excellent | Good | Good | Good |
| Funnels | Excellent | Excellent | Good | Good |
| Retention | Excellent | Excellent | Good | Good |
| Learning Curve | Medium | Medium | Low | Medium |
| Onboarding Tools | No | No | No | Yes |
Essential Event Tracking
Core Onboarding Events
Account Events:
user_signed_up
user_logged_in
user_logged_out
account_created
Onboarding Events:
onboarding_started
onboarding_step_completed
onboarding_completed
onboarding_skipped
Value Events:
first_value_achieved
activation_threshold_met
key_action_completed
Feature Events:
feature_first_used
feature_used
feature_explored
Event Properties
User Properties:
{
  user_id: "abc123",
  created_at: "2025-01-15",
  plan: "trial",
  company_size: "11-50",
  role: "marketing_manager",
  acquisition_source: "google_ads"
}
Event Properties:
{
  step_name: "profile_setup",
  step_number: 2,
  total_steps: 5,
  time_on_step_seconds: 45,
  completed: true
}
Event Naming Conventions
Consistent Format:
object_action or action_object
Examples:
project_created(notcreateProject)onboarding_completed(notOnboardingDone)feature_used(notused_feature)
Include Context:
- Where it happened
- What was involved
- Relevant metadata
Setting Up Tracking
Implementation Approach
Step 1: Plan Events
Document every event before implementing.
Step 2: Instrument Code
Add tracking calls to application.
Step 3: Validate
Verify events fire correctly.
Step 4: Set Up Reports
Build dashboards and analyses.
Code Implementation
Amplitude Example:
// Track event
amplitude.logEvent('onboarding_step_completed', {
  step_name: 'profile_setup',
  step_number: 2,
  time_on_step: 45
});

// Set user properties
amplitude.setUserProperties({
  plan: 'trial',
  role: 'marketing_manager'
});
Mixpanel Example:
// Track event
mixpanel.track('onboarding_step_completed', {
  step_name: 'profile_setup',
  step_number: 2,
  time_on_step: 45
});

// Set user properties
mixpanel.people.set({
  plan: 'trial',
  role: 'marketing_manager'
});
Using Segment
Segment as middleware:
// Single API call
analytics.track('onboarding_step_completed', {
  step_name: 'profile_setup',
  step_number: 2
});

// Routes to Amplitude, Mixpanel, etc.
Benefits:
- Single implementation
- Switch tools easily
- Consistent data across tools
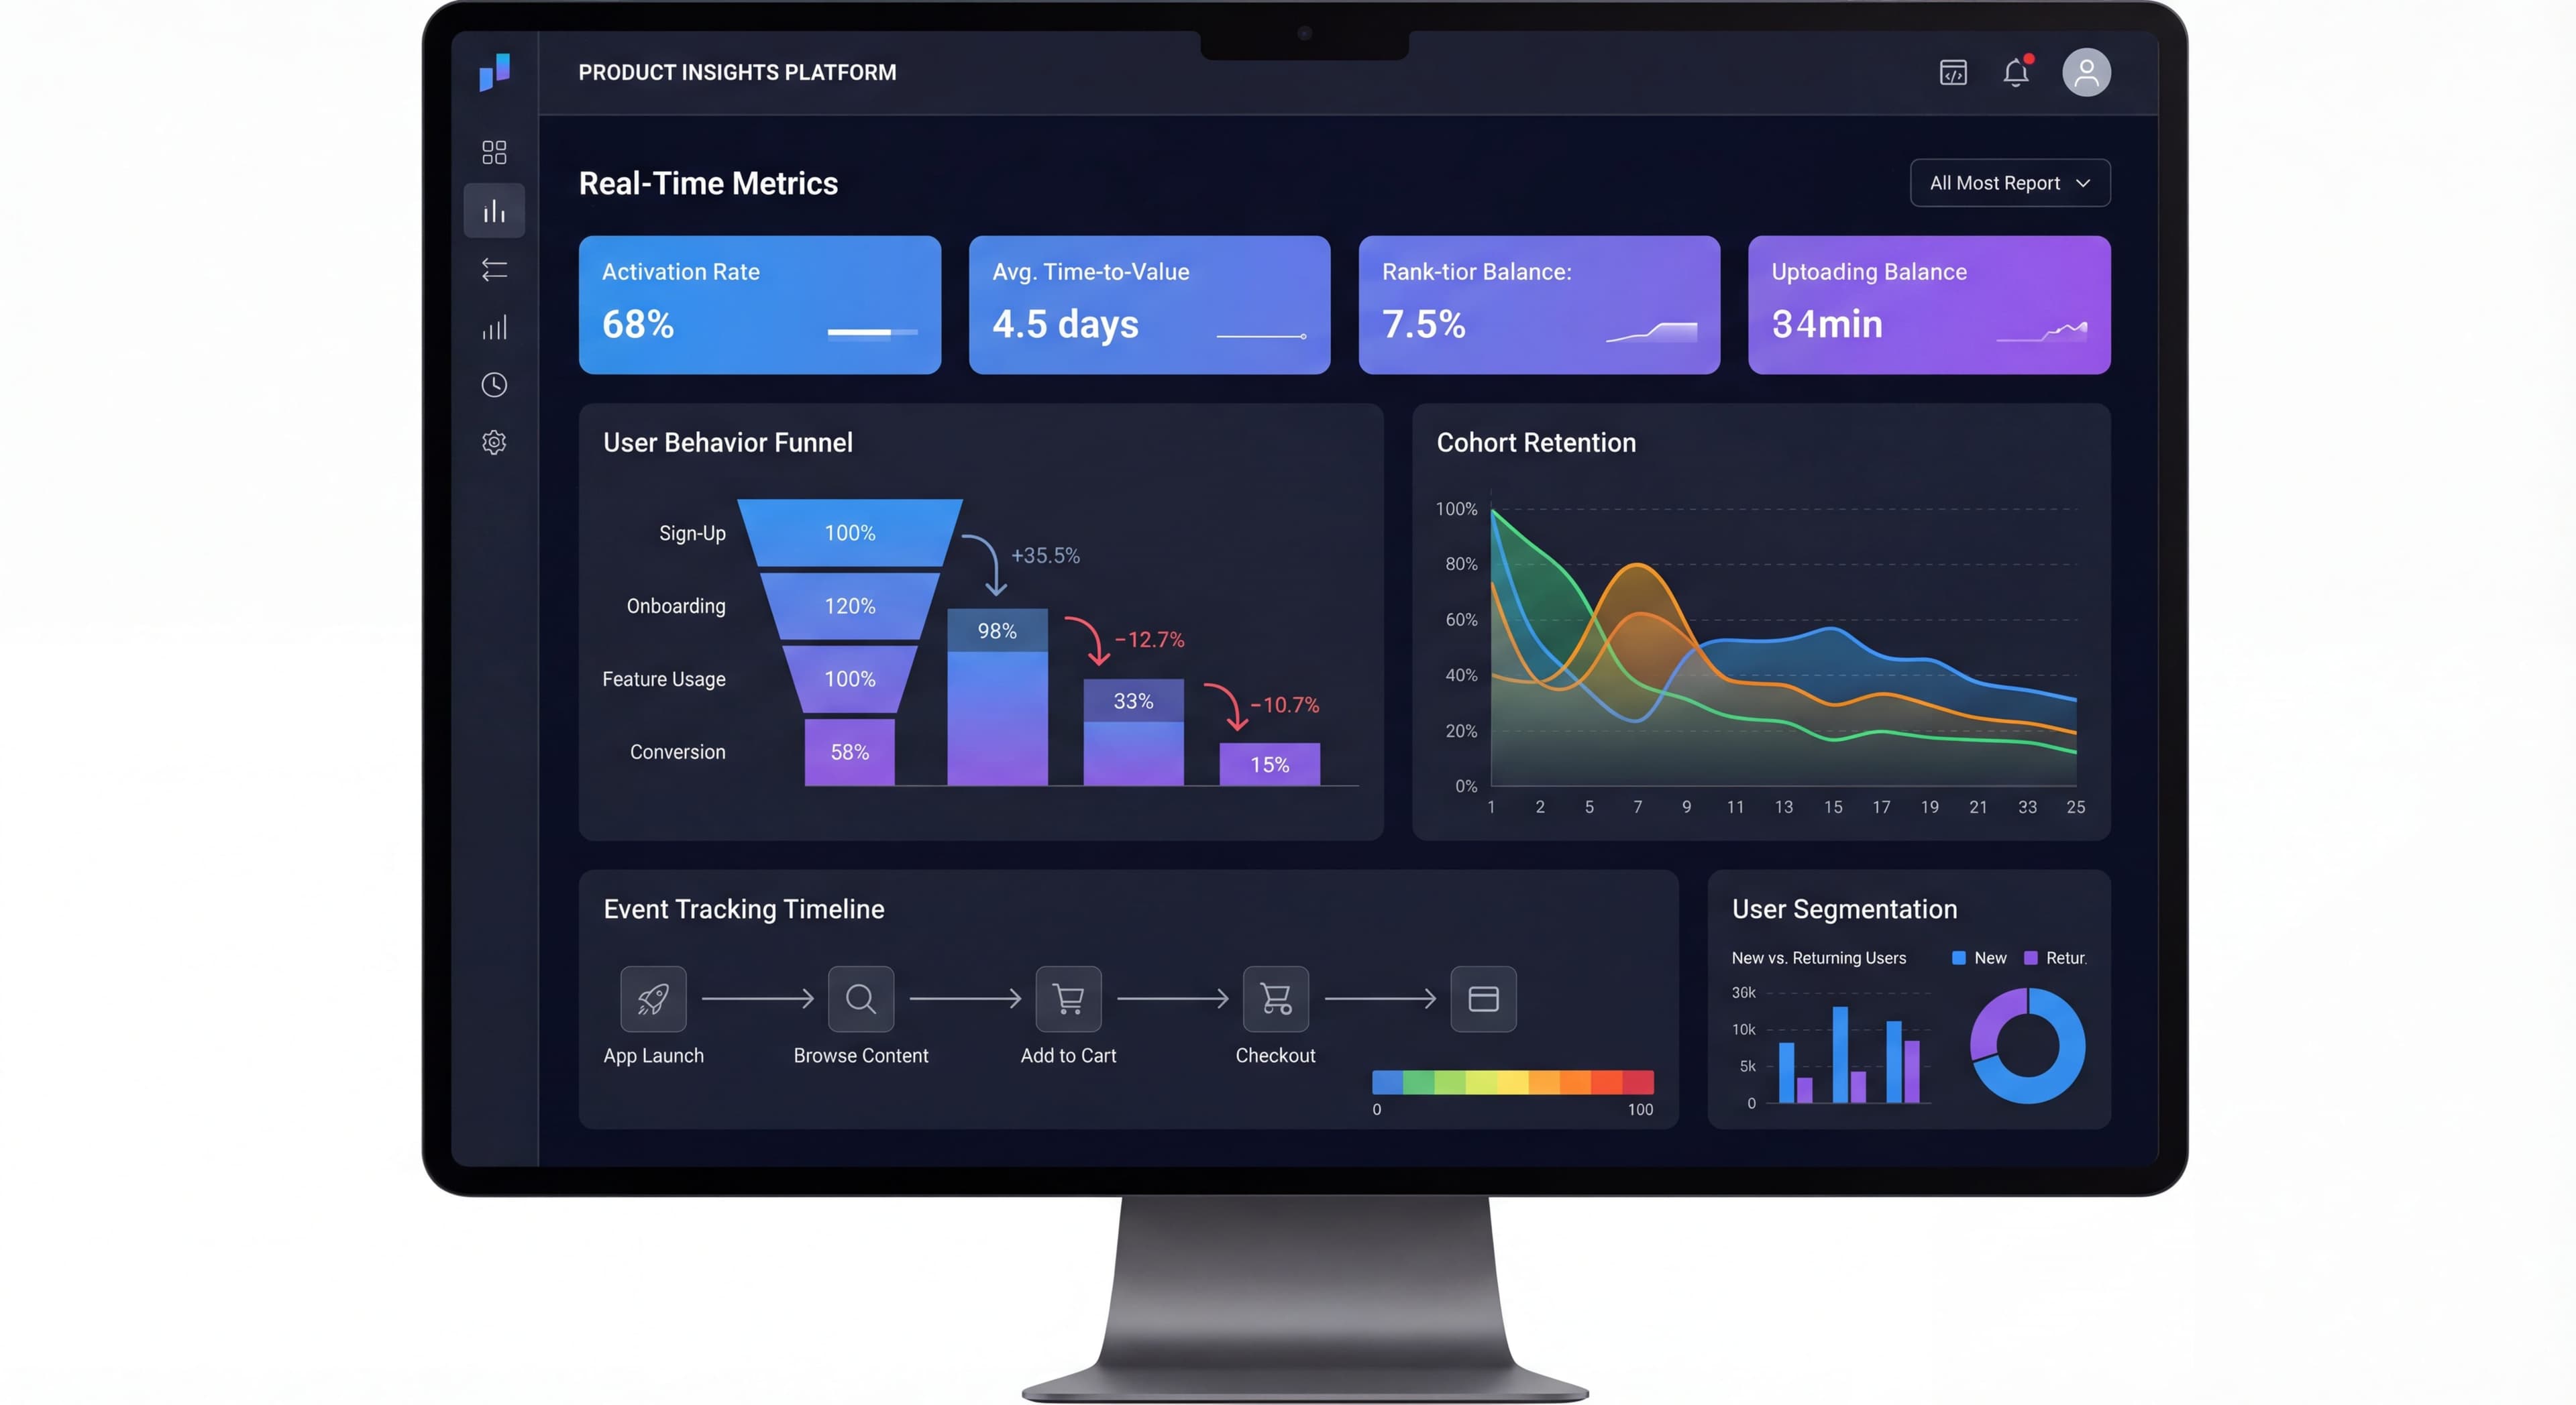
Building Onboarding Dashboards
Processes undocumented?
Create step-by-step SOPs that capture best practices in minutes with Glitter AI.
Essential Views
Overview Dashboard:
- Activation rate trend
- Key funnel metrics
- Alert indicators
Funnel Dashboard:
- Step-by-step conversion
- Drop-off visualization
- Segment comparison
Retention Dashboard:
- Retention curves
- Cohort analysis
- Trend comparison
Content Performance:
- Tour completion
- Checklist engagement
- Email metrics
Dashboard Template
Section 1: Health Metrics
KPIs:
- Activation Rate: 42% (↑ 3%)
- Time to Value: 8 min (↓ 2 min)
- Trial Conversion: 24%
- Day 7 Retention: 35%
Section 2: Funnel
Visualization showing:
Signup → Profile → First Action → Activation
With conversion rates and drop-offs
Section 3: Trends
Line charts showing:
- Weekly activation rate
- Monthly retention
- TTV over time
Section 4: Segments
Comparison tables:
- By user type
- By source
- By plan
Integrating with Onboarding Tools
Why Integration Matters
Without Integration:
- Onboarding tool works in isolation
- Analytics separate
- Manual correlation
With Integration:
- Unified data
- Better targeting
- Clearer attribution
Common Integrations
Segment Integration:
Most DAPs integrate with Segment, enabling:
- Event data into DAP
- DAP events into analytics
- Consistent user identification
Direct Integrations:
Many DAPs offer direct analytics connections:
- Appcues → Amplitude, Mixpanel, Heap
- Userpilot → Amplitude, Mixpanel
- Pendo → Native (is analytics platform)
Integration Setup
Example: Appcues + Amplitude
- Connect Appcues to Segment (or directly to Amplitude)
- Pass user ID from application to Appcues
- Appcues events flow to Amplitude
- Analytics data can trigger Appcues flows
Data Flow:
App Events → Analytics Platform
                    ↓
              Segment/CDP
                    ↓
              DAP Platform → DAP Events → Analytics
Analysis for Onboarding
Key Analyses to Run
Activation Analysis:
- What behaviors correlate with activation?
- Which user attributes predict success?
- What's the minimum path to activation?
Funnel Analysis:
- Where do users drop off?
- Which steps take longest?
- How do segments differ?
Retention Analysis:
- What Day 1 actions predict Day 30 retention?
- Which features drive stickiness?
- Where is early churn happening?
A/B Test Analysis:
- Did the change improve metrics?
- Was it statistically significant?
- Any segment differences?
Analysis Examples
Finding Activation Predictors:
- Define activated users
- Compare behaviors of activated vs. non-activated
- Identify significant differences
- Focus onboarding on those behaviors
Funnel Diagnosis:
- Build funnel from signup to activation
- Calculate step conversion rates
- Identify biggest drop-offs
- Investigate causes
Cohort Comparison:
- Create weekly signup cohorts
- Compare retention curves
- Identify what changed for better/worse cohorts
- Apply learnings
Processes undocumented?
Create step-by-step SOPs that capture best practices in minutes with Glitter AI.
Best Practices
Data Quality
Validate Events:
- Test every event implementation
- Check properties are correct
- Verify user identification
Consistent Naming:
- Document conventions
- Enforce through code review
- Audit regularly
Complete Coverage:
- Track all onboarding steps
- Include error events
- Capture timing data
Analysis Discipline
Regular Review Cadence:
- Weekly: Key metrics check
- Monthly: Deep dive analysis
- Quarterly: Strategy review
Document Learnings:
- What analyses revealed
- Decisions made
- Results of changes
Share Insights:
- Team dashboards
- Regular reports
- Cross-functional visibility
Privacy and Compliance
Data Handling:
- Minimize PII in events
- Follow data retention policies
- Enable user data deletion
Consent:
- Track consent status
- Respect opt-outs
- Document compliance
Common Mistakes
Mistake 1: Too Many Events
Problem: Tracking everything, analyzing nothing.
Fix: Focus on actionable events.
Mistake 2: Inconsistent Implementation
Problem: Events fire inconsistently or with wrong properties.
Fix: Thorough testing, code review.
Mistake 3: No User Identification
Problem: Can't connect anonymous to logged-in users.
Fix: Proper identity management.
Mistake 4: Analysis Paralysis
Problem: So much data, no decisions.
Fix: Focus on specific questions, take action.
Mistake 5: Ignoring Qualitative
Problem: Only quantitative data.
Fix: Combine with user research, surveys, session recordings.
Funnel drop-offs frustrating?
Create step-by-step guides that fix friction points and improve conversion at every step with Glitter AI.
The Bottom Line
Product analytics are the foundation of data-driven onboarding. The right tool, set up properly, shows you what's working, what's not, and what to do about it.
Key Principles:
- Choose tools that match your needs and resources
- Implement tracking thoroughly and correctly
- Build dashboards that drive decisions
- Integrate with your onboarding platform for the full picture
- Analyze regularly and actually take action
Analytics without action is just expensive data collection. The goal is insights that make onboarding better.
Continue learning: Onboarding Metrics KPIs and A/B Testing Onboarding.
Frequently Asked Questions
What is the difference between product analytics and web analytics for onboarding?
Web analytics (like Google Analytics) focuses on page views, sessions, and aggregate traffic patterns for anonymous users. Product analytics tracks individual user actions, events, and behavioral journeys within your product, which is essential for measuring and optimizing onboarding.
Which product analytics tool is best for onboarding optimization?
Amplitude and Mixpanel excel at behavioral analytics, cohort analysis, and funnel visualization for onboarding. Heap offers automatic event capture for teams with limited engineering resources, while Pendo combines analytics with built-in onboarding tools.
What events should I track to measure onboarding effectiveness?
Track core events including user_signed_up, onboarding_started, onboarding_step_completed, onboarding_completed, first_value_achieved, and activation_threshold_met. Include properties like step number, time on step, and completion status for detailed analysis.
How do I integrate product analytics with onboarding platforms?
Use Segment or a similar CDP to route data between your application, analytics platform, and onboarding tools. Most onboarding platforms like Appcues and Userpilot offer direct integrations with Amplitude and Mixpanel for unified data and better targeting.
How often should I review onboarding analytics?
Review key metrics weekly to catch issues quickly, conduct deep-dive analysis monthly to identify trends and opportunities, and perform quarterly strategy reviews to align onboarding with broader product goals. Document learnings and share insights across teams.