Integrating Onboarding Tools with Your Analytics Stack

Your onboarding tool shows tour completion rates. Your analytics platform shows user behavior. But the full picture, how tours impact activation, which flows drive retention, what content leads to conversion, requires connecting these systems.
This guide covers how to integrate your onboarding tools with your analytics stack so you actually know what's working.
Integration setup undocumented?
Create step-by-step guides that capture your analytics integration process so anyone can maintain it with Glitter AI.
Why Integration Matters
The Visibility Gap
The problem with siloed onboarding and analytics systems is that they only tell part of the story. Without onboarding analytics integration, your onboarding tool might report a 75% tour completion rate, which sounds great. Meanwhile, your analytics platform shows a 40% activation rate, which is concerning. These numbers exist in isolation. You can't answer the question that actually matters: are the users completing tours the same ones who activate, or are tours irrelevant to activation altogether?
This isn't just inconvenient. It genuinely undermines your ability to improve onboarding. You can't invest confidently in tour completion if you don't know whether it correlates with business outcomes. You can't prioritize which flows to build next without knowing which existing ones drive activation. You can't segment users properly because your analytics platform doesn't know about their onboarding behavior. Research on onboarding analytics shows that companies integrating their onboarding tools with analytics can build funnels tracking users from signup through tour completion to activation, revealing insights siloed data simply can't provide.
With integration, things get much clearer. You might discover that tour completers activate at 62% while skippers activate at only 28%. Tours more than double your activation rate. That single insight justifies your onboarding investment and tells you exactly where to focus. You can segment users by onboarding path and find that users who complete specific checklist items are three times more likely to hit their first value moment. You can connect downstream revenue to onboarding experiences, building real business cases for continued investment. Integrated data transforms onboarding from a feature team responsibility into a growth driver with measurable ROI.
Key Benefits
A unified user view pulls all user interactions into a single timeline. Instead of checking one system for tour interactions and another for feature usage, product teams can see complete user journeys connecting onboarding touchpoints to product behavior. This enables pattern recognition that siloed data can't provide. You might discover that users who interact with your resource center during onboarding adopt advanced features faster, or that certain tour variants lead to specific usage patterns. According to Amplitude's documentation, Segment onboarding integration lets behavioral cohorts be shared across your entire stack, enabling consistent segmentation from onboarding through retention.
Attribution connects onboarding experiences to downstream business outcomes, answering the "so what?" question that justifies investment. With proper integration, you can track user cohorts through their complete lifecycle and attribute differences in conversion, retention, and lifetime value to specific onboarding experiences. Did users who completed your advanced feature tour expand to paid at higher rates? Do checklist completers churn less? These insights transform vague beliefs about onboarding into quantified business impact that actually influences how resources get allocated.
Segmentation based on onboarding behavior opens up personalization possibilities. Rather than showing the same tour to every new user, you can trigger different experiences based on how users engaged with previous onboarding. Users who skipped your initial tour might respond better to a checklist. Users who completed basic onboarding but haven't touched key features become prime candidates for feature-specific tours. This behavioral segmentation enables increasingly sophisticated personalization as you learn what onboarding patterns predict which user needs.
Optimization speeds up when you have complete data connecting onboarding inputs to business outcomes. A/B tests become conclusive faster because you're measuring real outcomes (activation, retention, revenue) rather than proxy metrics (tour completion). You can identify where users drop off and correlate those drop-offs with subsequent behavior, revealing whether the drop-off means poor tour design or users who simply found what they needed. Complete data enables rapid iteration where insights lead directly to improvements that drive measurable impact.
Integration Architecture
Common Patterns
Pattern 1: Direct Integration
Onboarding Tool → Analytics Platform
                  (Amplitude, Mixpanel)
Simple, but creates separate data pipes.
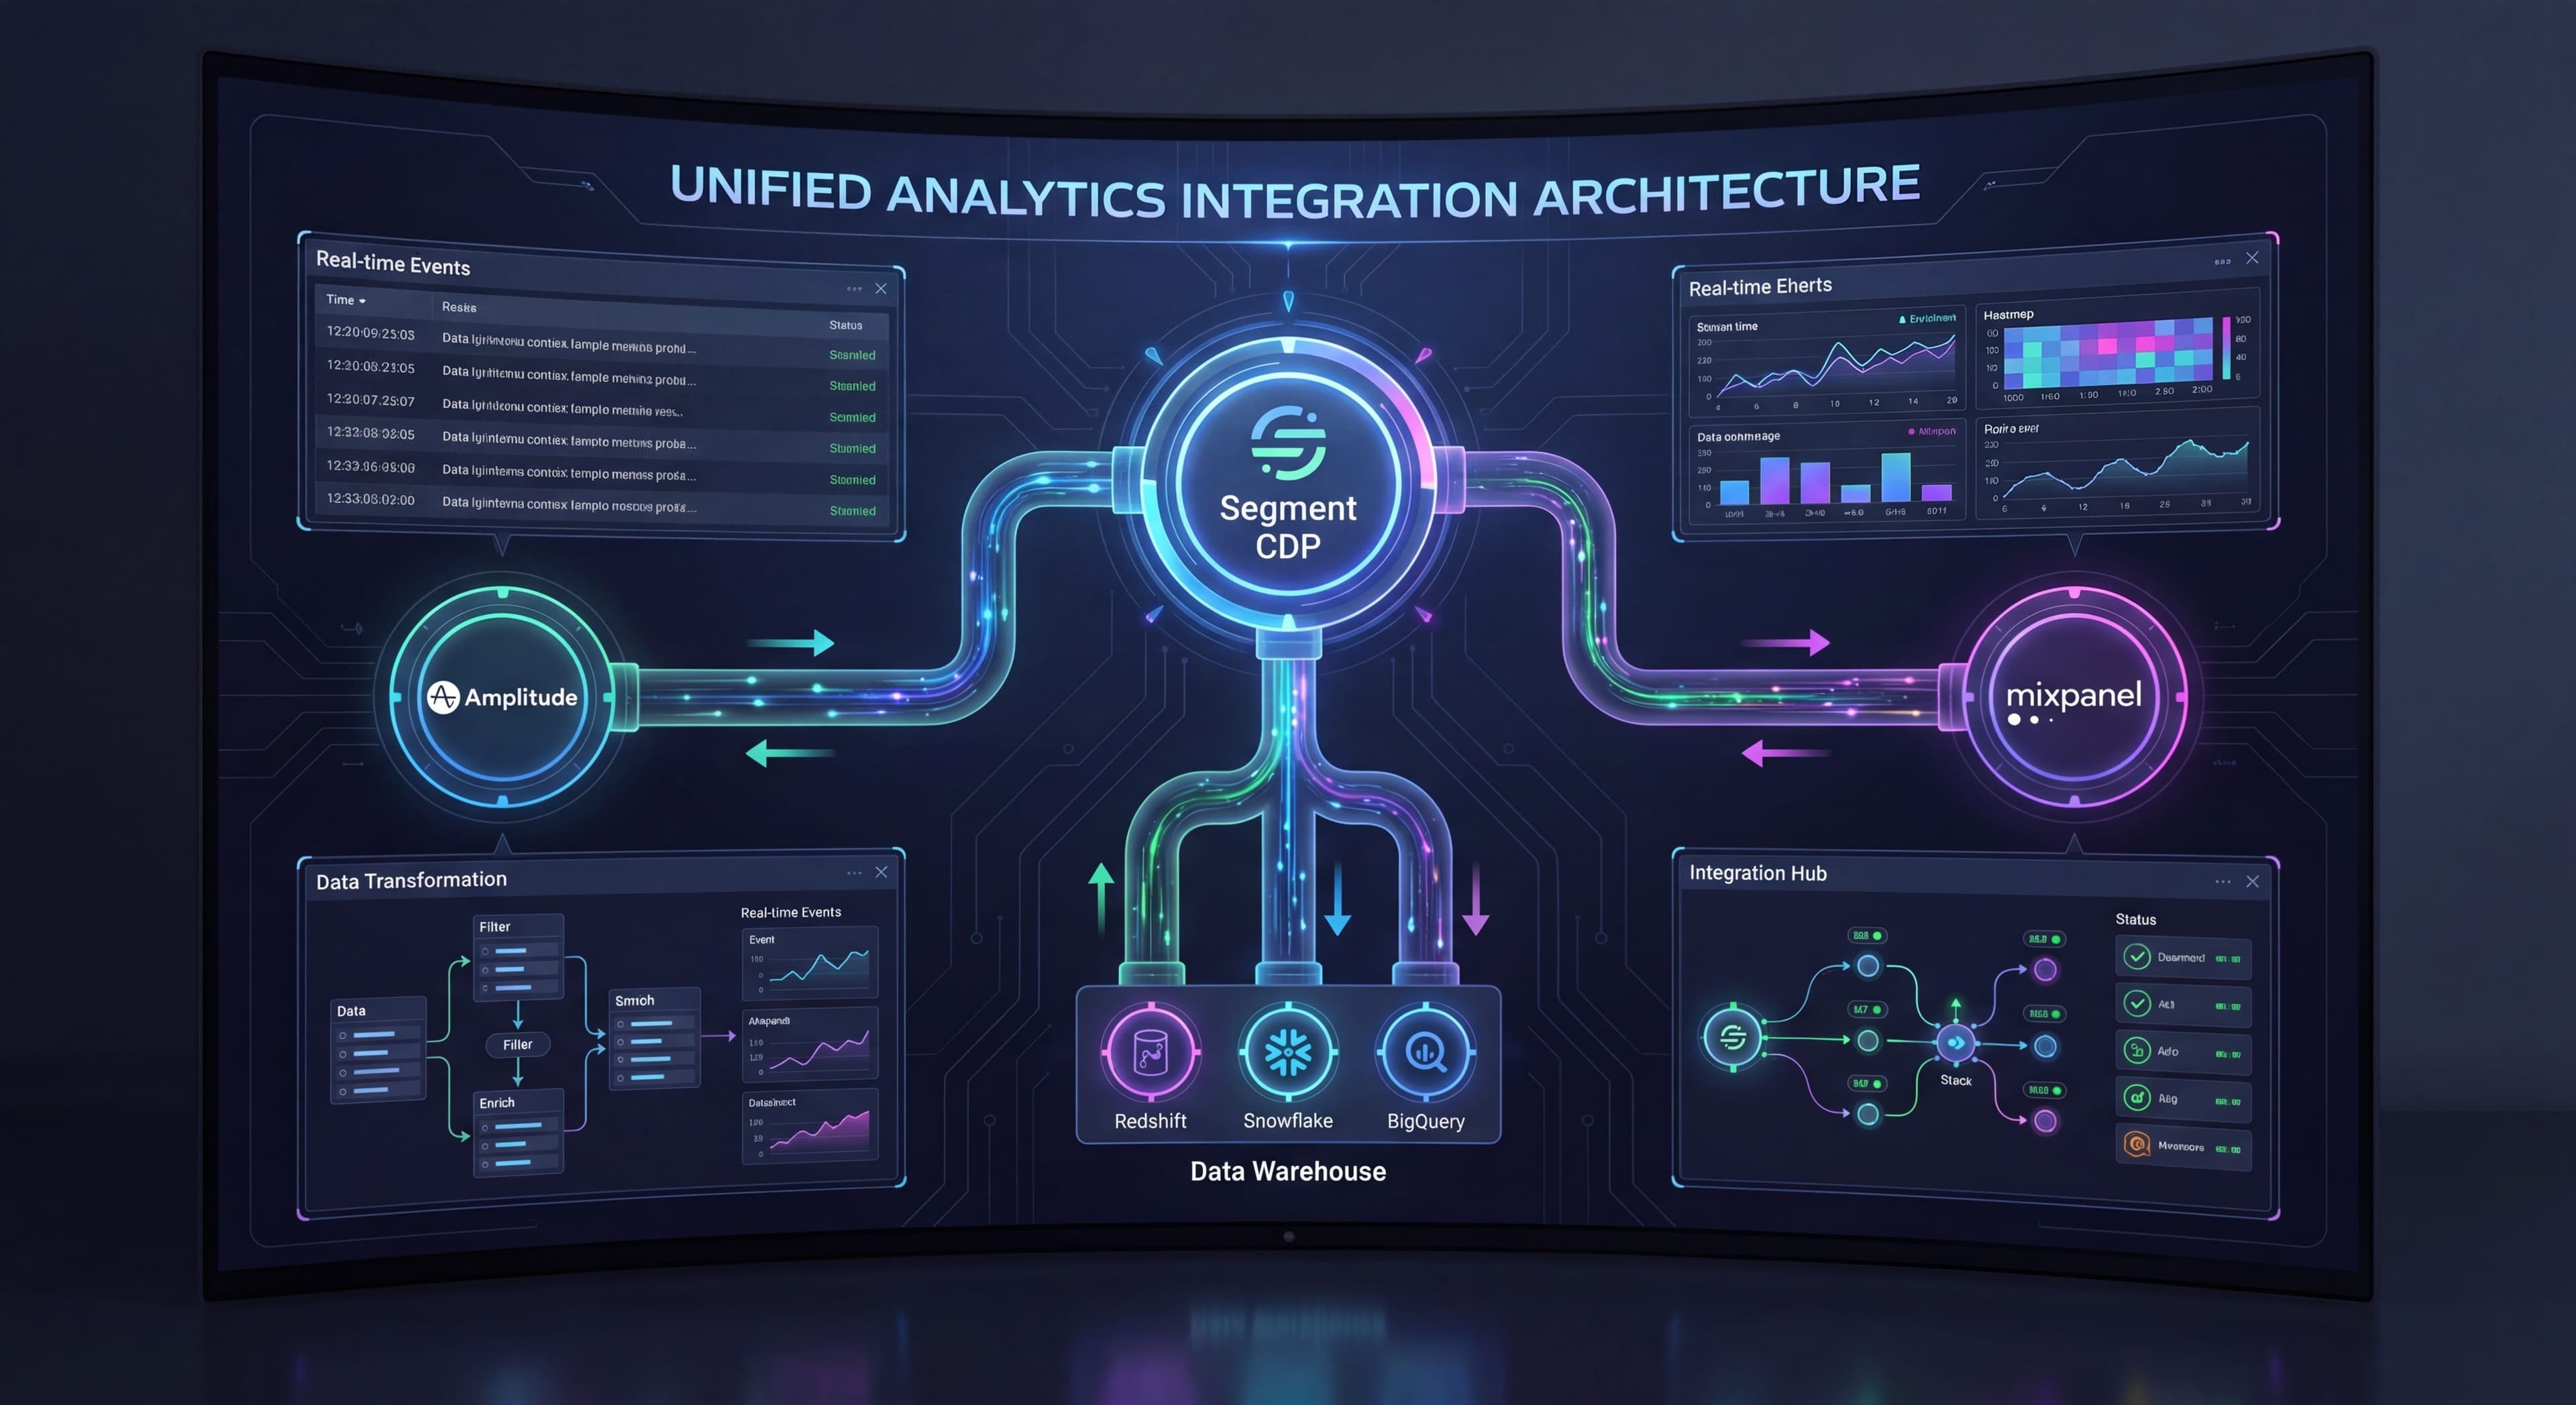
Pattern 2: CDP-Centric
Onboarding Tool → CDP (Segment) → Analytics
                               → Data Warehouse
                               → Marketing Tools
Single source of truth, scalable.
Pattern 3: Warehouse-Centric
Onboarding Tool → Data Warehouse → Analytics
Analytics Tool → Data Warehouse    BI Tools
Product Data → Data Warehouse
Most powerful, most complex.
Recommended Approach
For most teams: Start with CDP-centric (Pattern 2).
Why:
- Single integration point
- Easy to add destinations
- Consistent data model
- Scales with you
Setting Up Segment Integration
Why Segment First
Segment acts as a central hub:
- Send data once, distribute everywhere
- Consistent event naming
- Easy to add/remove destinations
- User identity resolution
Implementation Steps
Step 1: Install Segment
// Segment snippet
<script>
  !function(){var analytics=window.analytics=window.analytics||[];
  // ... rest of snippet
  analytics.load("YOUR_WRITE_KEY");
  analytics.page();
  }();
</script>
Step 2: Identify Users
// When user signs up or logs in
analytics.identify(userId, {
  email: user.email,
  name: user.name,
  plan: user.plan,
  createdAt: user.createdAt,
  company: user.company
});
Step 3: Track Events
// Track key actions
analytics.track('Signed Up', {
  plan: 'free',
  source: 'website'
});

analytics.track('Project Created', {
  projectId: '123',
  template: 'blank'
});
Connecting Onboarding Tools
Most DAPs Support Segment:
- Appcues: Native Segment integration
- Userpilot: Segment source and destination
- UserGuiding: Segment integration
- Pendo: Segment integration
- Chameleon: Deep Segment integration
Example: Appcues + Segment
- In Appcues: Settings → Integrations → Segment
- Enable "Send Appcues events to Segment"
- Events like
Appcues Flow Started,Appcues Flow Completedflow to Segment - Segment routes to your analytics tools
Two-Way Integration
From Product → Onboarding Tool:
Send user properties and events to trigger flows.
// Send event when user reaches milestone
analytics.track('Reached Milestone', {
  milestone: 'first_project',
  daysFromSignup: 3
});

// Onboarding tool receives event, triggers celebration
From Onboarding Tool → Analytics:
Send flow interactions for analysis.
// Events automatically sent by DAP:
// - flow_started
// - step_viewed
// - step_completed
// - flow_completed
// - flow_skipped
Event Taxonomy
Naming Conventions
Consistent Naming Matters:
Bad:
FlowStarted
flow-started
Flow Started
startedFlow
Good:
Flow Started  // Object Action, Title Case
Step Viewed
Flow Completed
Standard Convention:
[Object] [Action] in Title Case
Examples:
- Tour Started
- Tour Completed
- Checklist Item Completed
- Tooltip Viewed
Standard Onboarding Events
Flow Events:
// Flow lifecycle
analytics.track('Flow Started', {
  flowId: 'welcome-tour',
  flowName: 'Welcome Tour',
  flowType: 'tour'
});

analytics.track('Flow Completed', {
  flowId: 'welcome-tour',
  flowName: 'Welcome Tour',
  flowType: 'tour',
  completionTime: 45, // seconds
  stepsCompleted: 5,
  stepsTotal: 5
});

analytics.track('Flow Skipped', {
  flowId: 'welcome-tour',
  flowName: 'Welcome Tour',
  skipStep: 3,
  skipReason: 'user_dismissed'
});
Step Events:
analytics.track('Step Viewed', {
  flowId: 'welcome-tour',
  stepId: 'step-1',
  stepName: 'Welcome',
  stepPosition: 1,
  stepTotal: 5
});

analytics.track('Step Completed', {
  flowId: 'welcome-tour',
  stepId: 'step-1',
  stepName: 'Welcome',
  timeOnStep: 8 // seconds
});
Checklist Events:
analytics.track('Checklist Viewed', {
  checklistId: 'onboarding-checklist',
  checklistName: 'Getting Started',
  itemsTotal: 5,
  itemsCompleted: 0
});

analytics.track('Checklist Item Completed', {
  checklistId: 'onboarding-checklist',
  itemId: 'item-1',
  itemName: 'Create first project',
  itemPosition: 1
});

analytics.track('Checklist Completed', {
  checklistId: 'onboarding-checklist',
  timeToComplete: 1200, // seconds
  completionDate: '2025-01-15'
});
User Properties
Onboarding-Related Properties:
analytics.identify(userId, {
  // Standard properties
  email: 'user@example.com',
  plan: 'pro',

  // Onboarding properties
  onboardingStatus: 'in_progress', // 'not_started', 'in_progress', 'completed', 'skipped'
  welcomeTourCompleted: true,
  welcomeTourCompletedAt: '2025-01-15T10:30:00Z',
  checklistProgress: 60, // percentage
  activationDate: '2025-01-15',
  daysToActivation: 3
});
Analytics Platform Setup
Amplitude Integration
Via Segment:
- Segment → Destinations → Amplitude
- Enable destination
- Map events and properties
- Events flow automatically
Direct Integration:
// If using Amplitude SDK directly
amplitude.track('Flow Completed', {
  flow_id: 'welcome-tour',
  completion_time: 45
});
Building Onboarding Dashboards:
Key charts:
- Flow completion by date
- Activation rate by flow completion
- Time to activation by onboarding path
- Feature adoption by checklist completion
Mixpanel Integration
Via Segment:
- Segment → Destinations → Mixpanel
- Configure property mappings
- Enable destination
Direct Integration:
mixpanel.track('Flow Completed', {
  'flow_id': 'welcome-tour',
  'completion_time': 45
});
Mixpanel-Specific Features:
- Flow analysis for multi-step tracking
- Impact report for measuring outcomes
- Signal for anomaly detection
PostHog Integration
Via Segment or Direct:
posthog.capture('flow_completed', {
  flow_id: 'welcome-tour',
  completion_time: 45
});
PostHog Advantages:
- Built-in session recordings
- Feature flags integration
- Self-hosted option
Building Onboarding Funnels
Basic Onboarding Funnel
Signed Up → Tour Started → Tour Completed → First Action → Activated
In Amplitude:
- Create new funnel
- Add events in sequence
- Set conversion window
- Segment by user properties
Example Analysis:
Step 1: Signed Up         100% (1,000 users)
Step 2: Tour Started       85% (850 users)
Step 3: Tour Completed     70% (700 users)
Step 4: First Action       55% (550 users)
Step 5: Activated          40% (400 users)
Advanced Funnel Segments
Compare Segments:
- Tour completers vs skippers
- Different tour variants
- User roles/personas
- Acquisition channels
Example Insight:
Tour Completers: 62% activation
Tour Skippers: 28% activation
No Tour Exposed: 35% activation
Retention by Onboarding Path
Cohort Analysis:
Group users by onboarding experience:
- Completed full onboarding
- Partial completion
- Skipped onboarding
- Different tour variants
Track:
- Day 1, 7, 14, 30 retention
- Feature adoption over time
- Expansion behavior
Two-Way Sync for Targeting
Same questions over and over?
Create self-serve documentation that empowers users to help themselves with Glitter AI.
Sending Analytics Data to Onboarding Tools
Use Case:
Target flows based on product usage, not just onboarding state.
Example:
Show advanced feature tour when:
- User completed basic onboarding
- AND has used core feature 10+ times
- AND hasn't used advanced feature
Implementation with Segment:
// Analytics tracks usage
analytics.track('Feature Used', {
  feature: 'basic_reports',
  usageCount: 15
});

// User property updated
analytics.identify(userId, {
  basicReportsUsage: 15,
  readyForAdvanced: true
});

// Onboarding tool receives property
// Triggers advanced feature tour
Real-Time Targeting
Some DAPs Support:
- Event-triggered flows
- Real-time property sync
- Dynamic segmentation
Example Trigger:
// When user exports first report
analytics.track('Report Exported', {
  reportType: 'basic',
  firstExport: true
});

// Immediately triggers celebration + next steps flow
Debugging Integration
Common Issues
Events Not Appearing:
- Check Segment debugger
- Verify event names match
- Check destination configuration
- Review filtering rules
User Properties Not Syncing:
- Verify identify calls
- Check property mapping
- Review sync frequency
- Check for naming mismatches
Attribution Problems:
- Verify user ID consistency
- Check anonymous → identified transition
- Review session handling
Debugging Tools
Segment Debugger:
Real-time event stream, shows what's being sent.
Browser Console:
// Check if events fire
analytics.on('track', function(event, properties) {
  console.log('Event:', event, properties);
});
Analytics Platform Debugger:
Most platforms have real-time event viewers.
Testing Checklist
- Events appear in Segment debugger
- Events reach analytics destination
- User properties sync correctly
- Funnels calculate accurately
- Real-time targeting works
- Historical data imports (if applicable)
Same questions over and over?
Create self-serve documentation that empowers users to help themselves with Glitter AI.
Data Warehouse Integration
Why Add a Warehouse
Benefits:
- Historical analysis
- Custom queries
- Cross-system joins
- Machine learning inputs
Use Cases:
- Analyze onboarding impact on LTV
- Predict churn from onboarding behavior
- Build custom PQL scoring
- Deep cohort analysis
Architecture
Onboarding Tool → Segment → Warehouse (BigQuery/Snowflake)
Analytics Tool ↗            ↓
Product Database ↗     BI Tool (Looker/Metabase)
Sample Queries
Activation by Onboarding Path:
SELECT
  onboarding_path,
  COUNT(*) as users,
  SUM(CASE WHEN activated THEN 1 ELSE 0 END) as activated,
  SUM(CASE WHEN activated THEN 1 ELSE 0 END) * 100.0 / COUNT(*) as activation_rate
FROM users
JOIN onboarding_events ON users.id = onboarding_events.user_id
GROUP BY onboarding_path
ORDER BY activation_rate DESC;
LTV by Tour Completion:
SELECT
  welcome_tour_completed,
  AVG(lifetime_revenue) as avg_ltv,
  COUNT(*) as users
FROM users
JOIN revenue ON users.id = revenue.user_id
GROUP BY welcome_tour_completed;
Integration by Tool
Appcues
Native Integrations:
- Segment (source and destination)
- Amplitude
- Mixpanel
- Heap
Events Sent:
appcues:flow_startedappcues:flow_completedappcues:step_interactedappcues:form_submitted
Userpilot
Native Integrations:
- Segment
- Amplitude
- Mixpanel
- Google Analytics
Events Sent:
- Experience started/completed
- Checklist interactions
- Resource center usage
Chameleon
Native Integrations:
- Deep Segment integration
- Amplitude
- Mixpanel
- Custom webhooks
Special Features:
- Real-time property sync from Segment
- Event-triggered experiences
- Advanced targeting from analytics data
Pendo
Native Integrations:
- Segment
- Common analytics platforms
- Salesforce
Note:
Pendo includes its own robust analytics, so integration may be for data consolidation rather than analysis.
Privacy Considerations
Data Collection
What to Track:
- Flow interactions (non-PII)
- Completion status
- Timing data
- Aggregate behavior
What to Avoid:
- PII in event properties
- Sensitive user actions
- Data beyond what's needed
Compliance
GDPR/CCPA:
- Include onboarding tracking in privacy policy
- Honor consent preferences
- Enable data deletion requests
Implementation:
// Check consent before tracking
if (userConsentedToAnalytics()) {
  analytics.track('Flow Completed', {...});
}
Building an Integrated Dashboard
Key Metrics to Display
Onboarding Performance:
- Flow completion rates
- Step drop-off analysis
- Time to completion
Business Impact:
- Activation by onboarding path
- Retention by onboarding completion
- Revenue by onboarding cohort
Operational:
- Active flows
- Flow errors/issues
- Real-time completion
Dashboard Tools
Native Analytics:
Use Amplitude/Mixpanel dashboards for behavioral analysis.
BI Tools:
Use Looker/Metabase for cross-system views from warehouse.
Custom:
Build internal dashboards for specific needs.
Only one person knows the stack?
Create step-by-step SOPs that prevent knowledge silos in your analytics infrastructure with Glitter AI.
The Bottom Line
Integrating your onboarding tools with your analytics stack transforms onboarding from a black box into a measurable system you can actually optimize. The investment in proper onboarding analytics integration pays off in insights and optimization capability.
Key Principles:
- Use a CDP (Segment) as your integration hub
- Establish consistent event naming conventions
- Track flow lifecycle events thoroughly
- Enable two-way sync for targeting
- Build dashboards connecting onboarding to outcomes
The goal isn't just tracking onboarding events. It's understanding how onboarding drives the metrics that matter to your business.
Continue learning: Product Analytics for Onboarding and Funnel Analysis.
Frequently Asked Questions
Why should I integrate my onboarding tools with analytics platforms?
Without integration, you can see tour completion rates separately from user behavior, but you cannot connect them. With integration, you can measure whether tour completers activate at higher rates, attribute downstream outcomes to specific onboarding flows, segment users based on onboarding behavior, and optimize with complete data visibility.
How do I integrate Segment with my onboarding platform?
Install the Segment snippet, identify users with relevant properties (email, plan, signup date), then connect your DAP through native integrations. Most tools like Appcues, Userpilot, and Chameleon support Segment as both a source and destination, enabling two-way sync where onboarding events flow to analytics and user properties trigger targeted flows.
What onboarding events should I track in my analytics?
Track flow lifecycle events (Flow Started, Flow Completed, Flow Skipped), step events (Step Viewed, Step Completed with time on step), and checklist events (Checklist Viewed, Checklist Item Completed, Checklist Completed). Use consistent naming like Object Action in Title Case (e.g., Tour Started, Step Viewed) across all events.
How do I build an onboarding funnel in Amplitude or Mixpanel?
Create a funnel with events in sequence: Signed Up, Tour Started, Tour Completed, First Action, Activated. Set an appropriate conversion window and segment by user properties. Compare tour completers vs skippers to measure onboarding impact, and analyze cohorts by different tour variants to identify winning approaches.
What integration architecture should I use for onboarding analytics?
For most teams, use a CDP-centric approach with Segment as the hub: Onboarding Tool sends events to Segment, which routes to Analytics platforms, Data Warehouse, and Marketing Tools. This creates a single source of truth with consistent data models that scales as you add more destinations.